 Rapido
 Rapido
a visual profiler for Linux on x86.
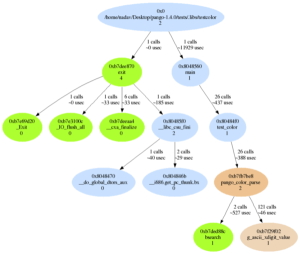
Rapido is a visual profiler for Linux-x86. The program helps in visualizing and describing what's going on in the heart of the program. It helps developers in finding and analyzing bottlenecks in their applications. Rapido scans the binary and the shared objects for symbols and analyzes the process during it's execution. Rapido will then produce a visual representation of the program flow.
The profiler records how many times each call was made and what is the average time it took for each each call to complete. Another feature of the program is the ability to focus and explore a single function inside a program or an entire DLL.
A profiler is much like a debugger. It helps in tracking bugs and finding bottlenecks. Rapido uses the same tools as GDB (The GCC debuger). Programmers who use profilers can only benefit from using debugers. Rapido is not a debuger in a way that it does not allow you to put break points and print variables. It also does not trace memory leaks, etc. Please look at the screenshots page for output example of Rapido. I traced Python, Perl, Bash and a few other Linux applications to demonstrace its abilities.
Currently I use libBFD for disassembly of binaries. This is the library which is used by objdump and gdb. LibBFD provides me with name mangling, disassembly, and symbols services. LibBFD's interface is terrible, but the functionality is great. In the future I may switch to using LLVM's disassembler or Distorm, if one of these disassemblers will provide me with the same functionality as libbfd.

Developed by Nadav Rotem